If you've ever kicked off a GPU training job and spent five minutes staring at "Pulling image..." before a single line of your code executes, you know the pain. Those minutes aren't free. At $2-30+/hour for GPU instances, idle hardware during image pull is money burning in a way that shows up clearly on your cloud bill.
We've spent the last year at Union.ai, the enterprise Flyte platform, working on this problem. The result: container cold boot times reduced by >94% (in some cases, under two seconds for a 10GB image on a fresh node). This article is a deep dive into what we built, why we built it, and the numbers.
The anatomy of a cold boot
Union.ai orchestrates ML and AI workflows on Kubernetes. Every task -- training run, data preprocessing step, inference job -- executes inside a container. Before that container can run your code, a series of things has to happen:
- Node provisioning: The cloud provider spins up a VM (1-5 minutes from zero)
- Image pull: The container image is downloaded from a registry to the node's disk
- Container startup: The container process initializes (~1 second)
- Environment setup: Python imports, framework initialization, library loading
- User code execution: Your actual work begins
For most workloads, phase 2 dominates. ML container images are large -- typically 5-20GB or more -- because they bundle frameworks like PyTorch or TensorFlow, CUDA libraries, numerical computing packages, and sometimes model weights. A standard Docker pull of a 10GB image on a fresh node takes 4-5 minutes. On a fresh node scaling from zero, you're looking at a total cold boot of 6-10 minutes before your code runs.
This is painful for everyone, but it's especially brutal for iterative ML development. When you're tuning hyperparameters, debugging a training loop, or experimenting with model architectures, you want a tight feedback loop. A 5-minute wait between "I changed one line" and "I can see the result" kills velocity.
Why we built this
We'd been thinking about cold boot optimization for a while. The problem was clear, but the solution space was wide.
We evaluated several approaches:
- Google Image Streaming (GKE-specific): Inconsistent first-pull performance, and it locks you into a single cloud provider.
- Custom AMIs/machine images: You can pre-bake images into your node's disk. It works, but the maintenance burden is significant -- every image update means a new AMI, new launch templates, new rollout.
- Layer optimization: Restructuring Dockerfiles to maximize layer cache hits. Useful, but incremental. You're still pulling gigabytes.
- Compression improvements (zstd): Faster decompression helps, but the bottleneck is data volume, not decompression speed.
None of these addressed the fundamental problem: the traditional container pull model downloads everything before starting anything. Your 10GB PyTorch image includes thousands of files, but your task might only touch a fraction of them at startup. You're waiting for the entire image to land on disk before the container can begin.
The key insight
What if the container didn't need to wait for the full image?
This is the idea behind lazy-loading snapshotters -- instead of downloading all image data upfront, you download a small metadata index, mount the filesystem immediately, and fetch file content on-demand as the running process actually accesses it.
We employed Nydus, an open-source lazy-loading container snapshotter and CNCF project. Nydus had the right combination of maturity, active development, and alignment with OCI standards.
Our LLM serving team had already proven the concept. When we built Union's managed vLLM and SGLang serving infrastructure, Nydus was part of how we achieved ~30-second cold boots for large model serving containers. The cold boot optimization project generalized this approach to all container workloads running on Union.ai.
Why traditional Docker pulls are slow
To understand why lazy loading is a fundamental shift and not just an incremental optimization, it helps to think through the physics of a standard Docker pull from first principles.
A Docker image is a stack of layers, each a gzip-compressed tar archive. When you docker pull, the runtime does the following:
- Download layers (in parallel, up to ~3 concurrent by default). The layers are fetched as opaque compressed blobs from the registry.
- Decompress each layer (sequential, single-core). Gzip decompression is inherently sequential — you cannot decompress byte 1000 without first decompressing bytes 0 through 999. There's no seeking, no random access. One core, start to finish.
- Extract the tar archive to disk.
- Mount the union filesystem (overlayFS) once all layers are ready.
- Start the container.
Steps 4 and 5 can only begin after every layer is fully downloaded, decompressed, and extracted. The container is blocked on the slowest layer.
Now let's do the math on what "fast" even looks like for this model.
Network transfer: A typical cloud VM gets 10-25 Gbps of network bandwidth to services within the same region. A 10GB image compressed to ~4GB is 32 Gbit. At a sustained 10 Gbps, that's 3.2 seconds of raw transfer time. At 25 Gbps, it's 1.3 seconds. So in theory, the network is fast enough to move the bytes in seconds.
Decompression: This is where the model breaks down. Gzip decompression on a single modern core runs at roughly 500 MB/s. For a 10GB uncompressed image, that's 20 seconds of CPU time — even with infinite bandwidth. And because gzip is sequential, you can't parallelize it across cores. Each layer decompresses on one core, one byte at a time.
Disk I/O: The decompressed data must be written to disk as individual files (tar extraction). On NVMe, this is fast but not free — lots of small files means lots of metadata operations.
The upshot: Even under ideal conditions — perfect network throughput, warm DNS, fast disk — a traditional Docker pull of a 10GB ML image has a floor of roughly 20-30 seconds just from decompression and extraction. In practice, registry latency, connection setup, layer ordering, and I/O contention push this to 1-5 minutes for large images.
This is a structural limitation of the format. You can't optimize your way out of "decompress everything sequentially before starting." You need a different model entirely.
Here's what that looks like in practice, using real numbers from our benchmarks on a 10GB ML image (node already provisioned):
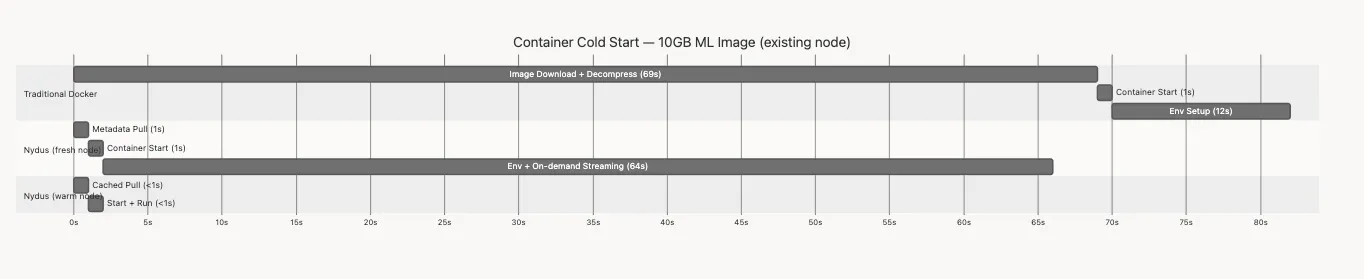
Notice how the traditional model front-loads all the waiting into the image pull phase — your container is blocked for over a minute before it can start. With Nydus on a fresh node, the container starts almost immediately and streams data as needed during execution. On a warm node, the entire process completes in under 2 seconds.
Lazy loading: a fundamentally different model
With Nydus, the sequence changes:
The metadata index is a compact manifest that describes the file tree — file names, sizes, permissions, chunk locations — without containing the actual file data. Once this index is on disk (a sub-second download), the filesystem is mountable and the container starts immediately.
When the running process opens a file — say, import torch triggers a read of the PyTorch shared libraries — Nydus intercepts the filesystem call and fetches the required data chunks from the backing store (a container registry or object storage). Chunks are fetched in parallel, decompressed independently (no sequential gzip dependency), and cached on local NVMe.
This model sidesteps every bottleneck in the traditional pull:
- No sequential decompression gate: Chunks are small and independently decompressible. Multiple cores can decompress in parallel.
- No "download everything" requirement: Only the data the process actually accesses gets fetched. A 10GB image where the task touches 2GB at startup means 2GB of transfer, not 10.
- Start time decoupled from image size: Whether the image is 500MB or 20GB, the container starts after downloading the same ~14MB metadata index. Image size affects execution speed (on-demand fetching), not start time.
Why this works especially well for ML workloads
ML container images have a property that makes lazy loading particularly effective: they contain a lot of stuff that isn't needed at any single invocation.
A typical ML image might include PyTorch and TensorFlow, multiple CUDA toolkit versions, dozens of Python packages, documentation, test files, and locale data. A given task might use 20-30% of the image content at startup. With lazy loading, you only pay the network cost for what you actually use.
There's also a cross-image deduplication benefit. Many ML images share common base layers — the Python runtime, numpy, core system libraries. When Nydus caches chunks from one image, those chunks are available to other images on the same node. In a cluster running diverse ML workloads, this shared cache compounds over time.
The image optimization pipeline
For lazy loading to work, images need to be in a Nydus-compatible format. We integrated this into Union's image builder, when you build or register a container image, Union.ai produces a Nydus-optimized version alongside the standard OCI image.
The conversion overhead is minimal. Using ZRan (Zlib Random Access for Nydus), converting a 353MB OCI image produces a ~14MB Nydus metadata index in about 11 seconds.
Node-level integration
Nydus runs as a containerd snapshotter plugin on each node. Our node bootstrap process configures kubelet, containerd, and the Nydus snapshotter as part of node initialization. We run canary containers, one optimized and one standard, as health checks to verify the system is working correctly before scheduling workloads.
We instrumented the entire pull path with OpenTelemetry tracing, giving us per-chunk visibility into pull performance, cache hit rates, and on-demand fetch latency. This telemetry was essential during development and continues to be how we monitor the system in production.
The numbers
We benchmarked with representative workloads based on the work our design partners and early customers shared.
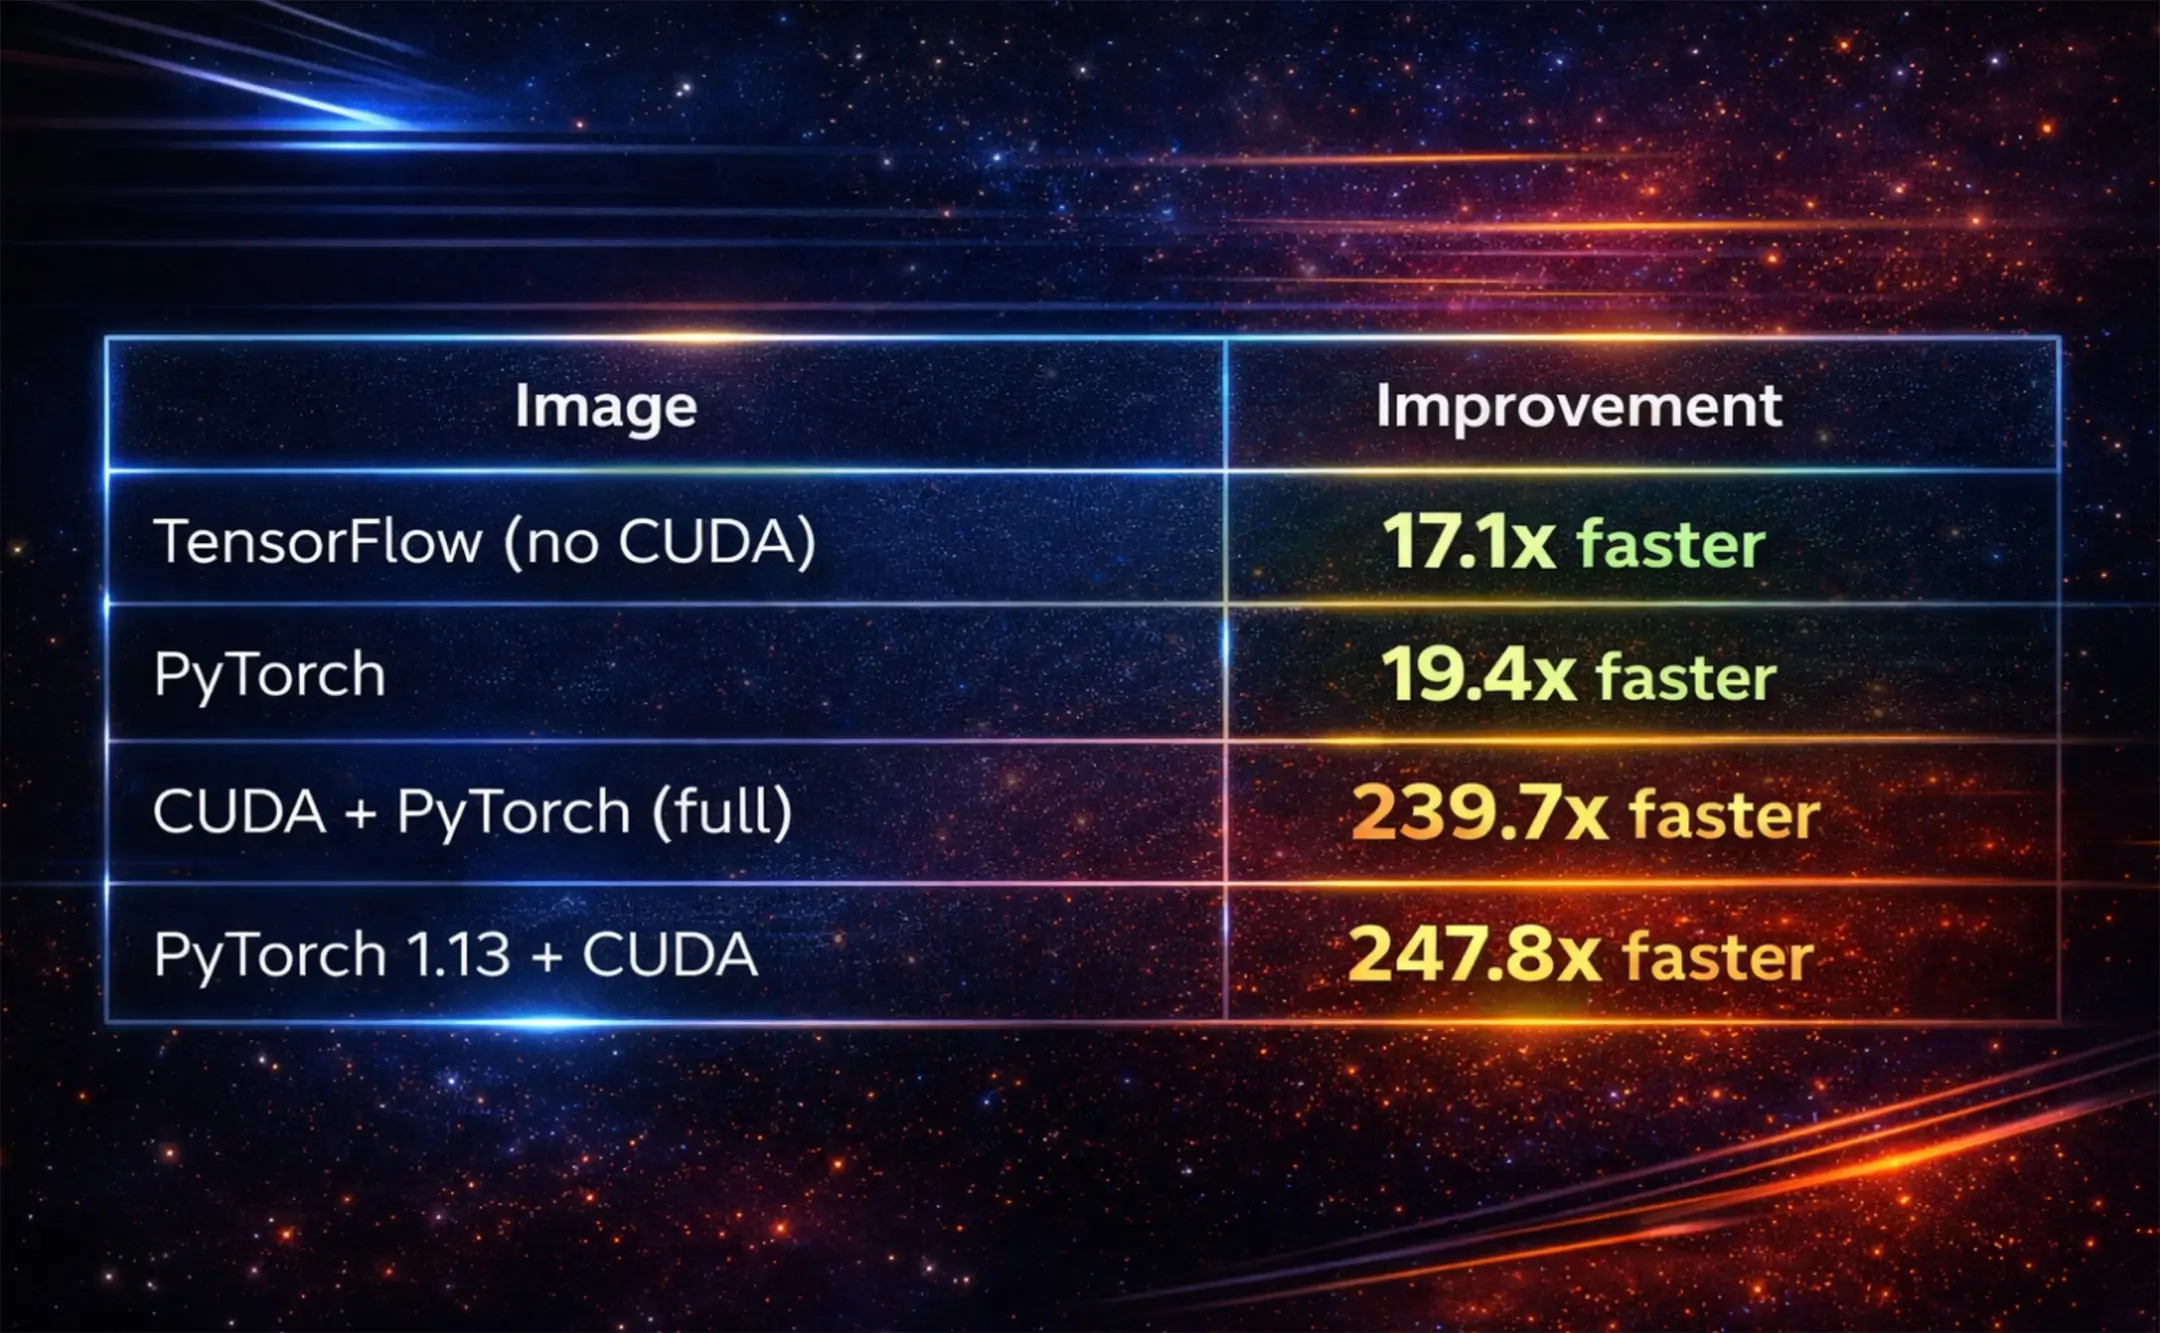
Image pull times: fresh node, no cache
Read that again: a 9.9GB CUDA + PyTorch image goes from 4 minutes 38 seconds to 1.16 seconds. That's not a percentage improvement, it's a category change.
Warmed node (image previously pulled)
On a node where the image has been pulled before, pull times drop to 163-728 milliseconds. Sub-second, consistently.
End-to-end workflow comparison
Raw pull time tells part of the story. Here's a real Flyte run comparison that captures the full picture, including the on-demand fetch overhead during execution:
On a fresh node with Nydus, you'll notice the execution phase is longer (29s vs 7s). That's because file data is being streamed on-demand during execution rather than pre-fetched. The total wall-clock time is still shorter -- 29.5s vs 2m 10s -- and the container started executing user code almost immediately instead of sitting idle.
On a warmed node, the difference is dramatic: ~2 seconds total, end to end.
LLM serving: Union.ai vs. SageMaker
We benchmarked our LLM serving infrastructure (deploying Llama 70B) against AWS SageMaker's published numbers:
- Union.ai: 55 seconds from node provisioning to serving
- SageMaker: 127 seconds (per their published benchmarks)
That means Union.ai is 2.3x faster than SageMaker. And on Union.ai, the difference between a fresh node and a node with a cached image is only 4 seconds of overhead. Once your cluster is warm, new model deployments are near-instant.
In production: Third Dimension cuts startup times >50%
Third Dimension builds photorealistic 3D scenes for robotics simulation -- the kind of workload where large container images are unavoidable. Their team works from a monorepo with a single development Docker image weighing in at roughly 20GB.
Before Union's cold boot optimization, every worker startup meant a multi-minute image pull. They'd looked into alternatives like baking custom instance images, but the operational overhead of maintaining those images was a non-starter for a fast-moving team.
With Union's optimization, they saw >50% reduction in startup times with zero changes to their workflows or Docker images.
"We were dealing with long worker startup times because our monorepo relies on a single development Docker image, which is fairly large and can take several minutes to pull. We'd explored ways to improve this before, but most of the options were pretty involved and usually meant baking and maintaining custom instance images,” said Piotr Sokolski, CTO of Third Dimension.
“Union's solution was genuinely plug-and-play, which made it stand out immediately. It reduced startup times by about 50%, which made a noticeable difference to how quickly we can get work running."
The "plug-and-play" part matters. The optimization happens at the infrastructure layer. Users don't change their Dockerfiles, their workflow definitions, or their deployment process. They just see faster starts.
What's next
Cold boot optimization is one of many technical investments we’re making in the Union.ai platform as we set the standard for AI-native orchestration. We're continuing to improve the caching layer and prefetch strategies; there are interesting opportunities around predicting which file chunks a container will need based on the task type and pre-warming the cache before the container starts.
Our larger vision is to make container cold boot invisible. Not "fast enough" -- invisible. Sub-second container starts for any image, any size, on any node. We're not there yet for every scenario, but the path from minutes to seconds is behind us, and the path from seconds to imperceptible is clearly in front of us.
Union.ai is the AI orchestration platform for Flyte. If you're running AI/ML workloads and cold boot times are slowing you down, let's chat: